
- Ethereum classic price after a massive rally witness sharp profit-taking, while the coin is in a continuous downtrend
- Presently the coin is trading above all vital moving averages of 20, 50, 100, and 200-day, whereas 20-DMA can act as a first support level
- The pair of ETC/BTC is trading negatively with an intraday loss of -2.87%, standing at 0.001868 BTC, while ETC/ETH drop nearly -8.77% CMP at 0.02437 ETH
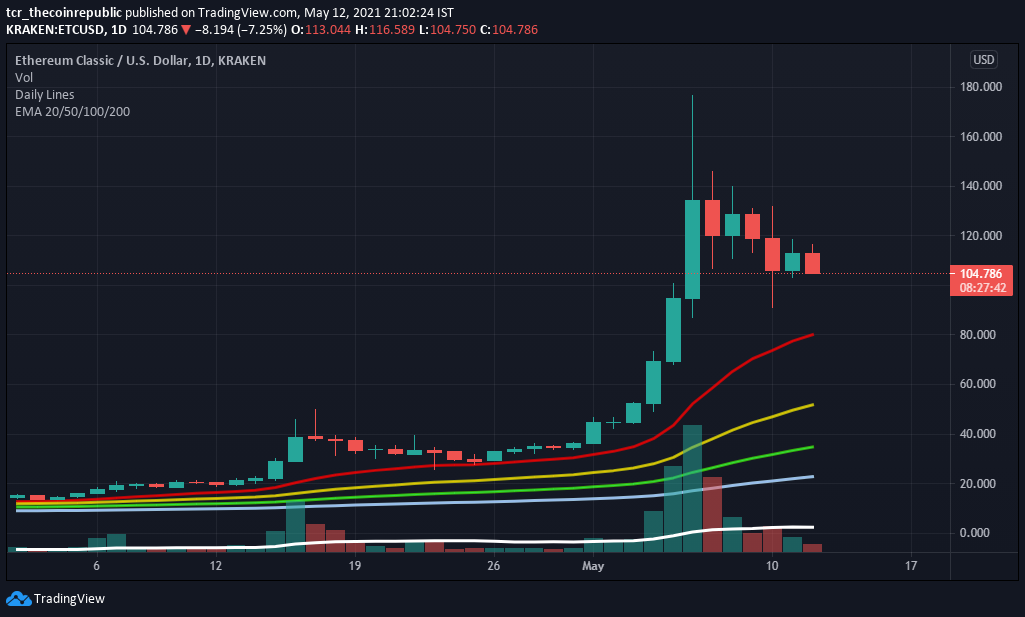
Ethereum classic price is trading on a bearish note over the monthly chart; after a strong bull run, the coin witnessed a sharp selloff from higher levels. However, the coin is still placed above all essential moving averages of 20, 50, 100, and 200-day, whereas 20-DMA can act as the initial support level. Meanwhile, the coin is currently trading near the psychological level of $100, which must behold for further positive momentum. Since the coin is in bearish momentum, we can see the momentum till 20-DMA ($80). Moreover, the support on the lower side is at $80 and $52; likewise, levels of $132 and $177 will act as resistance.
Weekly is Projecting a Significant Downtrend
Over the weekly chart, ETC price is projecting a significant downtrend. While making lower high and lower low patterns and all the technical parameters are in favor of bears. Moreover, ETC already faced colossal selling pressure, and it reached near the oversold territory so that some pullback can be observed. Presently the coin is trading at $103 with an intraday loss of -4.80%, and volume also falls nearly -29% standing at $9,504,458,814. Similarly, the total market capitalization at 18th position, which is standing at $11,887,916,813. However, minor support is at $90, which must behold, but if ETC breaches the support, we can see more selling pressure.
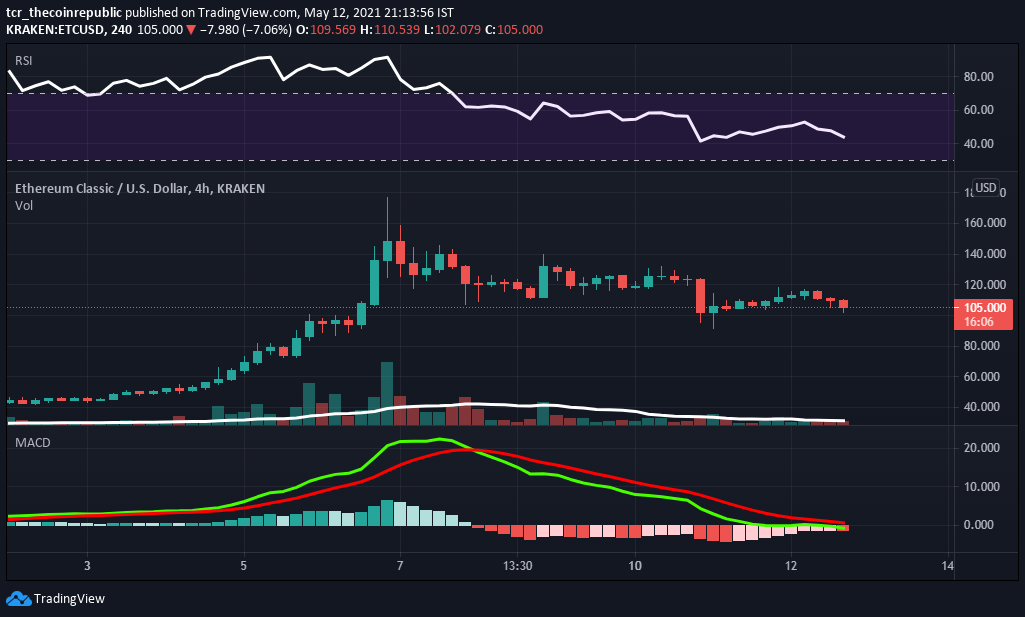
Relative Strength Index (BEARISH) indicates bearish momentum while trading at 43.62. However, ETC, after a sharp selloff, can see some pullback from lower levels, and RSI also reached near the oversold zone
ADVERTISEMENT
Moving Average Convergence Divergence (BEARISH) currently indicates a bearish trend on the daily chart. As ETC is trading with the significance of the seller’s line (red) over the buyer’s signal line (green).
Support levels: $90, $80 and $52
Resistance levels: $132 and $177


( π ) Pi is a new digital currency developed by Stanford PhDs, with over 15 million members worldwide. To claim your Pi, follow this link https://minepi.com/yildiztekin Download from your mobile phone and use username (yildiztekin) as your invitation code. Then mine from your mobile or desktop to collect Pi coin everyday.