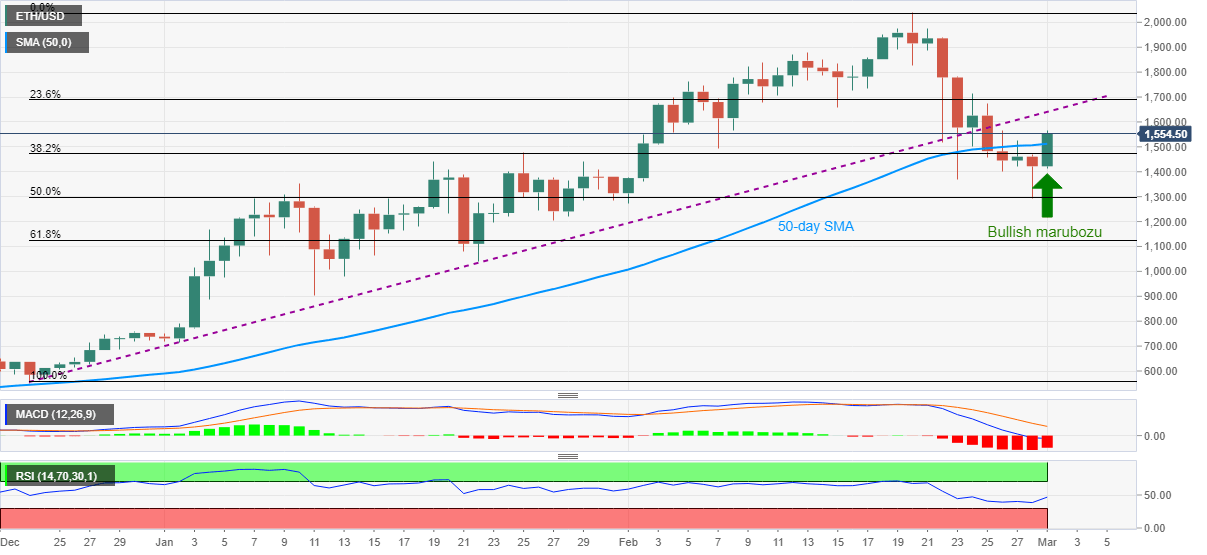
- ETH/USD stays on the front-foot while bouncing back beyond 50-day SMA.
- Bullish candlestick formation, RSI recovery weighs on bearish MACD to back the bulls.
- Key Fibonacci retracement levels raise bars for bear’s entry.
Ethereum keeps the month-start run-up while taking the bids near $1,560 during the initial trading on Tuesday. In doing so, the quote prints a ‘bullish marubozu’ candlestick on the daily (D1) chart.
Other than the bullish candlestick formation, RSI pick-up and the quote’s sustained break above 50-day SMA also favors the ETH/USD buyers.
As a result, an upward sloping trend line from December 23, 2020, previous support, near $1,640-45 lures the immediate upside momentum.
It should, however, be noted that eh altcoin’s upside past-$1,645 will be challenged by 23.6% Fibonacci retracement of late-2020 to February 20, 2021 upside, around $1,690.
In a case where the ETH/USD buyers fade momentum, a 50% Fibonacci retracement level of $1,298 becomes the key as it holds the gate for short-term sellers.
Following that, the 61.8% of Fibonacci retracement close to $1,125 and the $1,000 threshold will gain the market’s attention.
Overall, ETH/USD flashed is ready to challenge the previous downtrend but the bulls should remain cautious until witnessing a clear break of the earlier support line.
ETH/USD daily chart
Trend: Bullish
( π ) Pi is a new digital currency developed by Stanford PhDs, with over 15 million members worldwide. To claim your Pi, follow this link https://minepi.com/yildiztekin Download from your mobile phone and use username (yildiztekin) as your invitation code. Then mine from your mobile or desktop to collect Pi coin everyday.


